Last Updated: 3/9/2026
Warning
THIS IS AN AUTOGENERATED FILE. DO NOT EDIT.
Please edit the corresponding file in /packages/mermaid/src/docs/ecosystem/tutorials.md.
Tutorials
This is a list of publicly available Tutorials for using Mermaid.JS and is intended as a basic introduction for the use of the Live Editor for generating diagrams, and deploying Mermaid.JS through HTML.
Note that these tutorials might display an older interface, but the usage of the live-editor will largely be the same.
For most purposes, you can use the Live Editor , to quickly and easily render a diagram.
Live-Editor Tutorials
The definitions that can be generated the Live-Editor are also backwards-compatible as of version 8.7.0.
Chris Chinchilla: Hands on - Text-based diagrams with Mermaid
GitLab Unfiltered: How to Create Mermaid Diagrams
GitLab Unfiltered: Emilie adds a mermaid diagram to the handbook
World of Zero: I Learn How To Build Flowcharts and Signal Diagram’s in Mermaid.JS
Eddie Jaoude: Can you code your diagrams?
Mermaid with OpenAI
Elle Neal: Mind Mapping with AI: An Accessible Approach for Neurodiverse Learners Tutorial: , Demo:
Mermaid with HTML
Examples are provided in Getting Started
CodePen Examples:
https://codepen.io/CarlBoneri/pen/BQwZzq
https://codepen.io/tdkn/pen/vZxQzd
https://codepen.io/janzeteachesit/pen/OWWZKN
Mermaid with Text Area
https://codepen.io/Ryuno-Ki/pen/LNxwgR
Mermaid in open source docs
K8s.dev blog: Improve your documentation with Mermaid.js diagrams
Jupyter / Python Integration with mermaid-js
Here’s an example of Python integration with mermaid-js which uses the mermaid.ink service, that displays the graph in a Jupyter notebook and save it as .png image with the stated resolution (in this example, dpi=1200).
import base64
import io, requests
from IPython.display import Image, display
from PIL import Image as im
import matplotlib.pyplot as plt
def mm(graph):
graphbytes = graph.encode("utf8")
base64_bytes = base64.urlsafe_b64encode(graphbytes)
base64_string = base64_bytes.decode("ascii")
img = im.open(io.BytesIO(requests.get('https://mermaid.ink/img/' + base64_string).content))
plt.imshow(img)
plt.axis('off') # allow to hide axis
plt.savefig('image.png', dpi=1200)
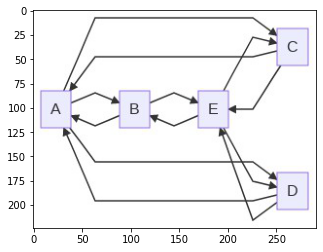
mm("""
graph LR;
A--> B & C & D
B--> A & E
C--> A & E
D--> A & E
E--> B & C & D
""")Output
{/- cspell:ignore Elle Jaoude Neurodiverse graphbytes imshow savefig -/}